Supply Chain Cost – The Numbers Every Manager Must Know
Supply chain management is one of the most significant economic drivers in any manufacturing or commercial organization. According to Gartner and Deloitte data, supply chain costs represent on average:
- Manufacturing: 50%–70% of total revenue
- Retail: 70%–85% of revenue
- Food & Beverage: 60%–75% of revenue
- Electronics: 55%–65% of revenue
- Pharma: 30%–45% of revenue
This analysis reveals that a 5% improvement in supply chain efficiency can impact organizational profitability as much as a 20%–30% growth in revenues.
Supply Chain Cost Components
Procurement Costs: 50%–70% of total chain costs – goods price, agent commissions, tariffs, and regulatory costs.
Inventory Costs: 20%–30% – holding costs, insurance, shrinkage, and frozen capital costs. The industry benchmark for inventory holding cost is 20%–25% of annual inventory value.
Logistics & Transportation: 5%–15% – freight, customs, insurance, and warehousing.
Management & Admin: 3%–7% – workforce, IT systems, and supplier management.
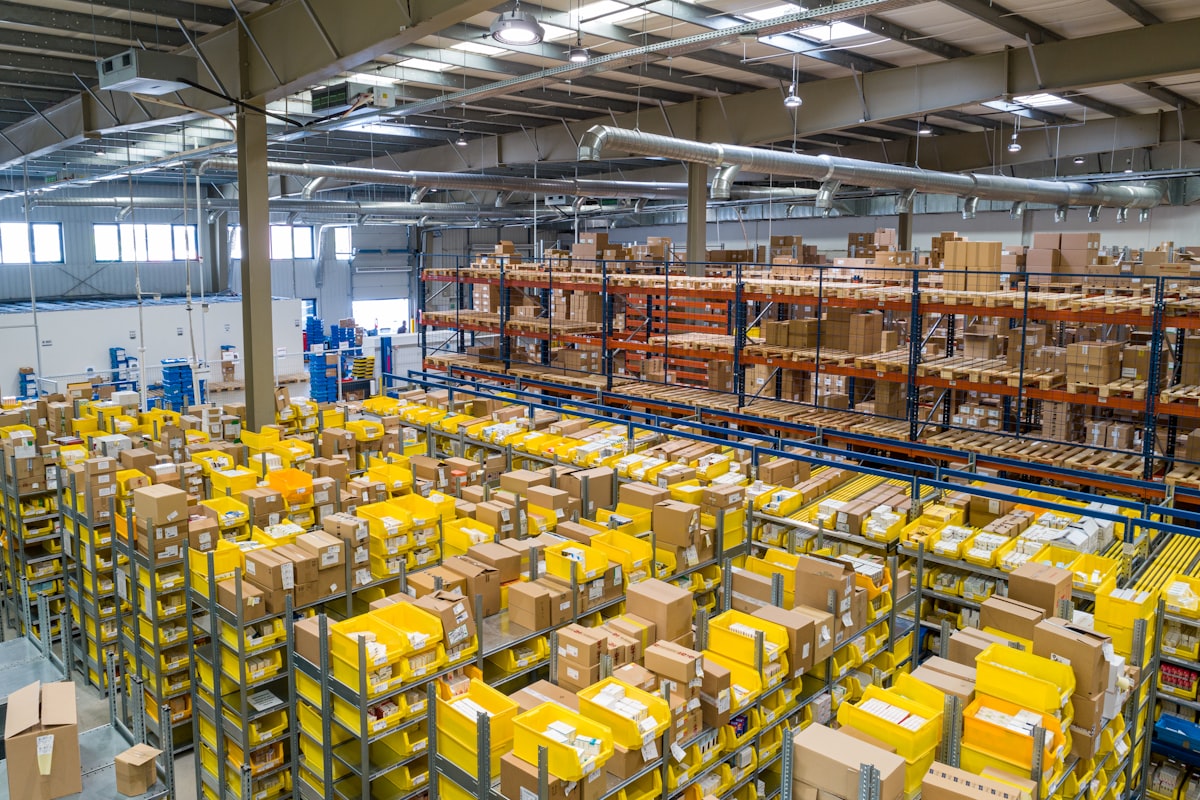
Supply Chain Performance Control – Key KPIs
OTIF (On Time In Full): Percentage of shipments delivered on time and in full quantity. Leading industries target 95%+. Service premiums or penalties are typically applied below 90%.
Inventory Turnover: How many times per year inventory “cycles.” Leading companies like Amazon and Zara report turnover of 8–12 times per year; the industry average is 4–6.
Days of Supply (DSI): How many operating days current inventory can support. Industry norms vary: food retail – 15–30 days; electronics – 30–60 days; pharma – 60–90 days.
Cost per Order: Average cost to process a customer order end-to-end. Industry benchmark is $50–$150 per order in manual processes; automated systems achieve $8–$20.
COGS as % of Sales: Metric for manufacturing and procurement efficiency. S&P 500 manufacturing average is approximately 65%–70%.
Recommended AI Applications in Supply Chain Management
Demand Forecasting: AI analyzes historical sales data, seasonal trends, market data, and even social media to accurately predict demand. Companies implementing AI in demand forecasting report 20%–40% accuracy improvement over traditional methods.
Inventory Optimization: ML algorithms calculate optimal inventory levels at every point in the chain—including dynamic safety stock adjusted to uncertainty levels in the supply environment.
Supplier Risk Management: AI monitors tens of thousands of risk factors in real time—including supplier financial health, weather events, geopolitical tensions, and compliance risks—alerting on potential issues before they materialize.
Supply Chain Digital Twin: Creating a complete digital copy of the supply chain enables simulation of possible disruptions and testing of response scenarios before real-world implementation.
RPA Automation: Robotic Process Automation handles repetitive processes such as order processing, vendor onboarding, and invoice verification—freeing valuable time for analytical and strategic work.
Real-World Examples
Amazon: Amazon’s AI systems manage a supply chain of 350M+ products, with 99.7% OTIF and inventory turnover of 9–11 times per year. The AI predicts and moves products to fulfillment centers before customers even place their orders.
Walmart: An AI demand forecasting system delivered a 16% reduction in inventory costs while maintaining 98.5% product availability.
Maersk: The shipping giant implemented AI to optimize sea routes and reduced operating costs by 10% while improving delivery times.
Conclusion
Proper performance control and smart use of AI are the two most significant tools for improving supply chain efficiency. Organizations investing in these areas will gain a meaningful competitive advantage for years to come.
📩 For consulting on supply chain management and improvement – Contact Mashik